 |
Evolution Links to our Past News of the Present Insight for the Future |
© Linnean Society of London |
The Broad Concept of Descent with Change
| Understanding Family Trees |
|
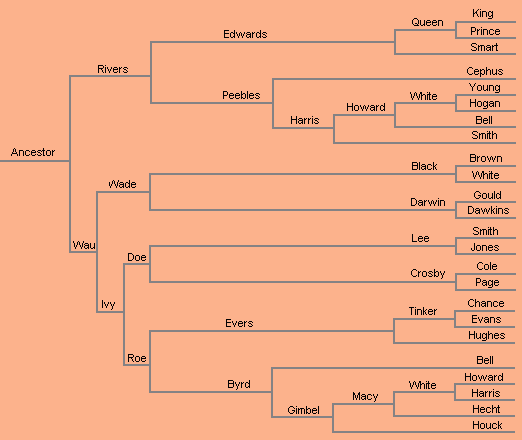
Almost everyone intuitively understands the pictorial representation of a family tree. If you go to a family reunion there may be a big chart around somewhere, showing the entire clan for many generations. The chart below is how a family clan diagram might look. Some family names last for several generations until they change through marriage – or die out for lack of progeny. This is a simple pictorial guide to evolution through a small number of human generations. When such a chart is accompanied with photos going back 100 years (or when lots of cousins, grandparents or great-grandparents are present) we can also visualize more easily how we change over time. A few generations of human evolutionary change is but a blink of an eye compared to what has gone before. It might take 25,000-50,000 generations -- a half million to a million years or more – for really significant change to occur. Notice how a family tree "branches."
 |
| Geneology, Genetics and DNA |
|
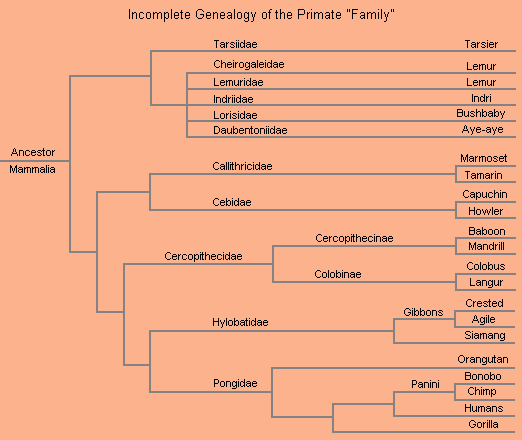
By now most people are aware that it is possible to prove genealogical descent by scientific testing of DNA samples obtained from potential parents, children and siblings. The settlement of paternity lawsuits and criminal indictments, using such evidence, are daily occurrences. Such tests, when properly conducted, offer stronger evidence than human affidavits which may in part be the result of human emotion, bias or prejudice. DNA evidence, combined with other non-controversial historical evidence, recently brought to closure the long-suspected relationship between Thomas Jefferson, or his brother, and Sally Hemmings. It is now common practice in science to prove the genealogical relationships existing between species of animals and plants. The same rigorous methodologies required by courts of law are employed, offering us the same high degree of confidence that the resulting evidence is worthy of being accepted as factual truth. The genetic "distance" or gross difference between the tested subjects permit us to determine which subjects or specimens are members of the same species, or of different higher groupings such as genera, families, orders and so forth. In the great majority of instances, genetic testing of living forms confirms the previous understanding of various scientists who based their genealogies on morphology, osteology, embryology and other scientific disciplines. The next "Family Tree" shows the relationships for a small number of the species included in the Order Primata, the Primates which include you and me. For brevity only a few of the 200+ living species of primates are shown. The best arrangement for the group at the top of the chart, from Tarsiers through Aye-aye, remains unsettled and speculative.
 |
| Branching Points, Genetic Change and Time |
|
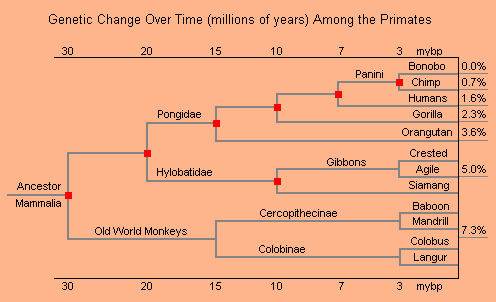
Why are apes and monkeys still living if we come from them? For the same reason that your parents and grandparents did not die because you were born. If you are an only child you are a lineal descendent of your parents. If you have one or more siblings, however, you represent a branching point in genealogy. You and your siblings could be the founders of new lines of speciation with your parents being the most recent common ancestors. Likewise, your cousins do not necessarily die out, leaving no offspring, while you and your children and grandchildren prosper. In the chart below the red dots represent branching points in Primate ancestry. The two living species of Chimpanzees diverged or split off from common parental stock about 3 million years ago. Since that time they have diverged genetically by about .7%. They continue to share about 99.3% of their genetic makeup. Their common ancestors are now extinct. Our hominid ancestors, together with chimp ancestors, branched from the great ape lineage about 7 million years ago. Today, we and the chimps share about 98.4% of our genetic makeup. The 1.6% difference between us and chimps indicates that they are our closest living relatives in the animal kingdom. The living Gorilla last shared a common ancestor with us about 10 million years ago. Gorillas are genetically 2.3% distant from both chimps and us. Gorillas are not as close to humans or chimps as chimps and humans are to each other. By the same token, the two living forms of Chimpanzee are more closely related to each other than humans are to them. We branched from the Orangutan about 15 million years ago, from the Gibbons about 20 mybp, and from the Old World Monkeys about 30 mybp. Separation from the New World Monkeys, Lemurs and other primates occurred even further back in time. Note that genetic difference in Primates appears to occur at a fairly uniform average rate of about .7% per three million years. Genetic change over time virtually guarantees the evolution of new species. Try to keep this point in mind. When our ancestors diverged from the Chimp ancestors, there were no Chimps or Humans. Chimps and Humans took millions of years to evolve into the three species we see today. During that long interval numerous of our ancestors (and theirs), and other close relatives, have gone extinct.
 |
| The "Missing Links" in Hominid Ancestry |
|
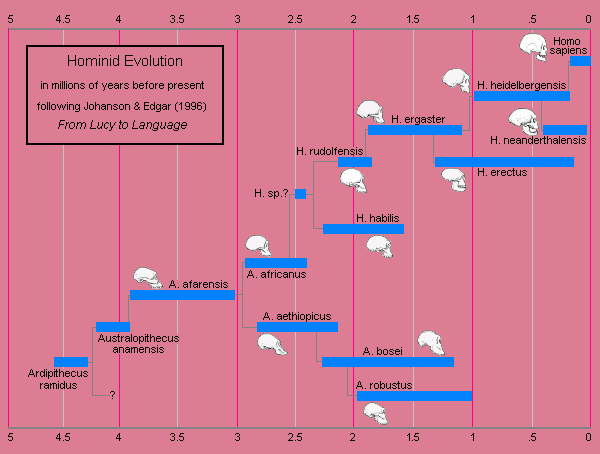
At the time Charles Darwin wrote On The Origin of Species (1859), we had no fossils of Human ancestors. Through tremendous effort in searching for fossils the next chart can show about 13-14 "links" between modern Humans and our Gorilla cousins, going back about 5 of the 10 million years to our split in lineage. For each of the species in this chart there are from 5 to 500 fossil or sub-fossil specimens. We have the most specimens for Neanderthals. As new fossil sites are discovered it may be expected that our confidence in this chart will grow (or it will be modified) and that even more intermediate links will appear on it. Note that as many as 4 or 5 species of early hominids were living at the same time. Observe also that, in at least a half-dozen instances, a parental species continued to exist for a lengthy period of time after a daughter species evolved.
 |
| Evolution Within the Human Family |
|
You might recall from the Primate family tree that Humans are about 1.6% different from Chimpanzees in our DNA. Within the human family, according to the next chart, we differ between each other by about .03% when we compare different language groups around the world. This is less than 1/50th the difference between our family and chimps (and perhaps a measure of time since the origination or flourishing of human languages. I cannot resist but point out that, according to this chart, human language did not diversify because of a Tower of Babel. Take time to think about it.
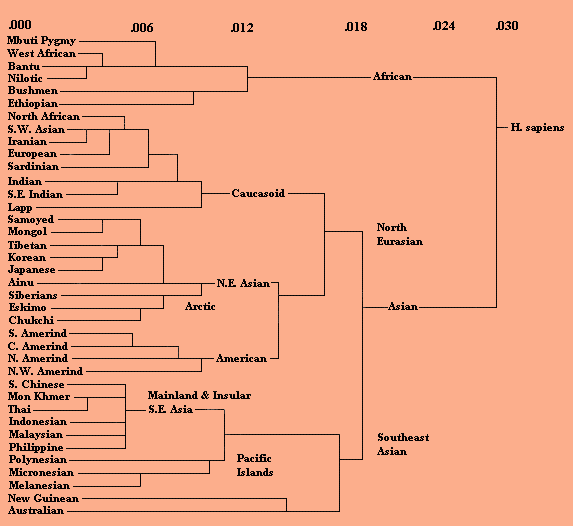 Notice the smooth transitions in the Pacific Island, Siberian/Eskimo and American lineages, consistent with what logic has already informed us of settlement patterns in those areas. The data in this table are largely or entirely drawn from one article in Scientific American, "Genes, peoples and languages," by Luigi Luca Cavalli-Sforza (November, 1991). This reported the results of genetic mapping of human DNA affinities, the newest theories about larger families of human languages, and a comparison between the two. The chart itself came from the website: Genetic Distance and Language Affinities
More on the subject by Dr. Cavalli-Sforza may be found on the Books Page.
|
| Reading the Code of a DNA Molecule |
|
DNA is composed of two nucleotide chains connected to each other by hydrogen bonds. The diagram below shows a portion of one of the chains of such a DNA molecule. This segment of DNA is equivalent to the first 10 letters of the DNA code shown for Species A in the next table. The d stands for the sugar, deoxyribose, the p for phosphate and A, C, T and G for the nitrogenous bases, adenine, cytosine thymine and guanine. Note that the backbone of this strand is composed of alternating sugar and phosphate molecules. Computerized biochemical laboratories can now examine DNA from any source, determine the molecular nature of a specimen, and display on a computer terminal, print out, or store on a computer disk the code for the DNA. The DNA code may then be compared with that of other specimens from the same or different species of animals or plants.
 |
| How DNA Cladograms Are Constructed |
|
The chart below represents the data used for a very simplified example of a DNA cladistic diagram. The table with long strings of letters shows a snippet of the same segment of DNA for each of 8 individuals or species. Differences in the DNA code, wherever found, appear as bold characters.
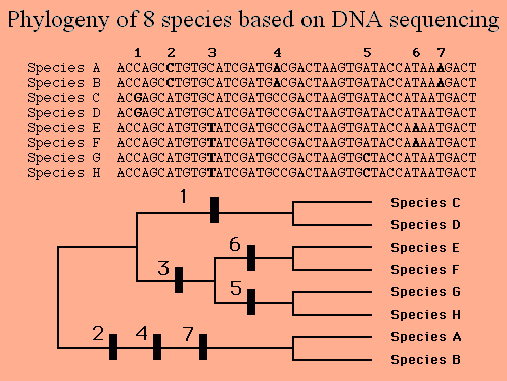 The cladistic diagram pairs the species with similar DNA codes. Black bars on the horizontal lines indicate DNA differences for each species or species group. Notice that two pairs of species share a DNA character at [3]. That character might be considered ancestral for the two species groups (EF and GH) and could indicate a last common ancestor.
Actual DNA comparisons would normally involve a much longer strand of DNA involving dozens or hundreds of characters. The larger the set of data under comparison the
greater the confidence that may be placed on the findings.
|
Books | Botany | Cell Biology | Chemistry | Creationism | Current News | Darwiniana
Dict. / Encyclo. | Ecology | Education | Essays | Eugenics | Evolution | Fossil Record
Genetics | Geology | Gouldiana | Health | Homework | Human Origins | Intermediates
Math | Museums | Origin of Life | Paleontology | Photos | Physics | Reference Aids
Science Journals | Sociobiology | Taxonomy | Transitionals | The Universe | Zoology
intro1.htm Last Updated April 22, 2026 Links verified April 22, 2026